Thursday, February 29, 2024

Spring Boot Event Driven Microservice With Kafka

In this post we'll see how to write event driven microservice using Spring Boot and Kafka. In the example we'll see how to use Kafka as a message broker that enables services to communicate with each other and exchange information.

Message brokers can validate, store, route, and deliver messages to the required destinations. They act as a middleware allowing producers to send messages without having any location information about the consumers of the messages, without knowing whether consumers are currently active or not or what is the count of consumers. This abstraction facilitates decoupling of services within systems and asynchronous communication among the services.


Kafka - Brief introduction

Apache Kafka is an open-source distributed event streaming platform which combines the following three capabilities-

  • To publish (write) and subscribe to (read) streams of events
  • To store streams of events durably and reliably for as long as you want.
  • To process streams of events as they occur or retrospectively.

And all this functionality is provided in a distributed, highly scalable, elastic, fault-tolerant, and secure manner.

Some of the terminology used in Kafka is as given below-

  1. Events- An event records the fact that "something happened" in your application. When you read or write data to Kafka, you do this in the form of events. The message you write to Kafka may have a key and data which can be a String, a complex object.
  2. Producers- Those client applications that publish (write) events to Kafka,
  3. Consumers- Those applications that subscribe to (read and process) these events.
    In Kafka, producers and consumers are fully decoupled and agnostic of each other. This clear separation helps Kafka in achieving high scalability.
  4. Topics- Events are organized and durably stored in topics. Topics in Kafka are always multi-producer and multi-subscriber which means a topic can have zero, one, or many producers that write events to it, as well as zero, one, or many consumers that subscribe to these events.
    Unlike traditional messaging systems, in Kafka, events are not deleted after consumption.
    Topics are partitioned, meaning a topic is spread over a number of "buckets" located on different Kafka brokers. When a new event is published to a topic, it is actually appended to one of the topic's partitions. Which partition to send the event is determined by the key passed with the event. Events with the same event key (For example customer ID, account ID ) are written to the same partition, and Kafka guarantees that any consumer of a given topic-partition will always read that partition's events in exactly the same order as they were written.
kafka topics

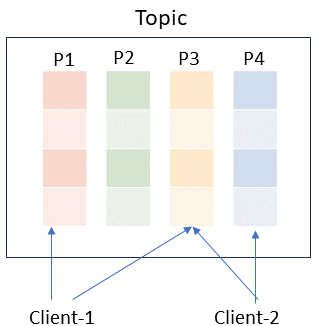
Events with the same key (denoted by their color in the figure) are written to the same partition.

Kafka as message broker

Kafka works well as a replacement for a more traditional message broker. In comparison to most messaging systems Kafka has better throughput, built-in partitioning, replication, and fault-tolerance which makes it a good solution for large scale message processing applications.

Spring Boot Microservice + Kafka Example

In the example we'll create an order-service which acts as a producer of orders and order-consumer-service which gets that order data and then do further processing of those orders (for example do payment and then change the order status to processed or rejected).

We'll configure a Kafka topic, order-service will write orders to that topic, order-consumer-service will read orders from the topic.

order-service Microservice

In STS create a new Spring Starter Project and give details as given here.

Name: order-service. Java version used is 17, packaging is Jar and project type is Maven. In the next window select the dependencies as shown in the following image.

Spring Boot Kafka

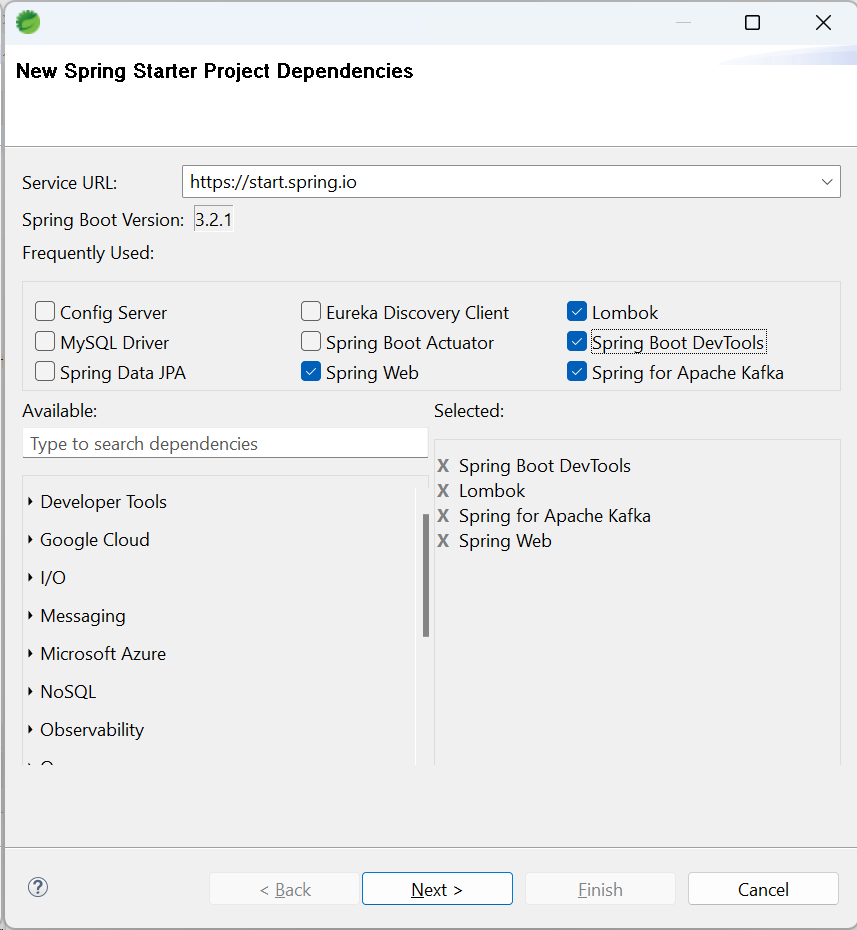
The Spring for Apache Kafka (spring-kafka) project applies core Spring concepts to the development of Kafka-based messaging solutions. It provides a "template" as a high-level abstraction for sending messages. It also provides support for @KafkaListener annotation.

With these dependencies added the created pom.xml should look like this-

<?xml version="1.0" encoding="UTF-8"?>
<project xmlns="http://maven.apache.org/POM/4.0.0" xmlns:xsi="http://www.w3.org/2001/XMLSchema-instance"
  xsi:schemaLocation="http://maven.apache.org/POM/4.0.0 https://maven.apache.org/xsd/maven-4.0.0.xsd">
  <modelVersion>4.0.0</modelVersion>
  <parent>
    <groupId>org.springframework.boot</groupId>
    <artifactId>spring-boot-starter-parent</artifactId>
    <version>3.2.1</version>
    <relativePath/> <!-- lookup parent from repository -->
  </parent>
  <groupId>com.netjstech</groupId>
  <artifactId>order-service</artifactId>
  <version>0.0.1-SNAPSHOT</version>
  <name>order-service</name>
  <description>Order Producer Service
</description>
  <properties>
    <java.version>17</java.version>
  </properties>
  <dependencies>
    <dependency>
      <groupId>org.springframework.boot</groupId>
      <artifactId>spring-boot-starter-web</artifactId>
    </dependency>
    <dependency>
      <groupId>org.springframework.kafka</groupId>
      <artifactId>spring-kafka</artifactId>
    </dependency>

    <dependency>
      <groupId>org.springframework.boot</groupId>
      <artifactId>spring-boot-devtools</artifactId>
      <scope>runtime</scope>
      <optional>true</optional>
    </dependency>
    <dependency>
      <groupId>org.projectlombok</groupId>
      <artifactId>lombok</artifactId>
      <optional>true</optional>
    </dependency>
    <dependency>
      <groupId>org.springframework.boot</groupId>
      <artifactId>spring-boot-starter-test</artifactId>
      <scope>test</scope>
    </dependency>
    <dependency>
      <groupId>org.springframework.kafka</groupId>
      <artifactId>spring-kafka-test</artifactId>
      <scope>test</scope>
    </dependency>
  </dependencies>

  <build>
    <plugins>
      <plugin>
        <groupId>org.springframework.boot</groupId>
        <artifactId>spring-boot-maven-plugin</artifactId>
        <configuration>
          <excludes>
            <exclude>
              <groupId>org.projectlombok</groupId>
              <artifactId>lombok</artifactId>
            </exclude>
          </excludes>
        </configuration>
      </plugin>
    </plugins>
  </build>

</project>

OrderDto class

POJO class used to produce and consume data.

import java.util.List;
import lombok.AllArgsConstructor;
import lombok.Builder;
import lombok.Data;
import lombok.NoArgsConstructor;

@Builder
@Data
@NoArgsConstructor
@AllArgsConstructor
public class OrderDto {
  private List<String> items;
  private double amount;
  private String status;
}

Controller Class

Class that will receive request for the designated path and move it forward to Service class.

import org.springframework.beans.factory.annotation.Autowired;
import org.springframework.web.bind.annotation.PostMapping;
import org.springframework.web.bind.annotation.RequestBody;
import org.springframework.web.bind.annotation.RequestMapping;
import org.springframework.web.bind.annotation.RestController;
import com.fasterxml.jackson.core.JsonProcessingException;
import com.netjstech.orderservice.dto.OrderDto;
import com.netjstech.orderservice.service.OrderService;

@RestController
@RequestMapping("/order")
public class OrderController {
  @Autowired
  private OrderService orderService;
  
  @PostMapping
  public void createOrder(@RequestBody OrderDto order) throws JsonProcessingException {
    orderService.sendOrder(order);
  }
}

Order Service interface and Impl class

import com.fasterxml.jackson.core.JsonProcessingException;
import com.netjstech.orderservice.dto.OrderDto;

public interface OrderService {
	public String sendOrder(OrderDto order) throws JsonProcessingException ;
}
import org.springframework.beans.factory.annotation.Autowired;
import org.springframework.stereotype.Service;
import com.fasterxml.jackson.core.JsonProcessingException;
import com.netjstech.orderservice.dto.OrderDto;

@Service
public class OrderServiceImpl implements OrderService{
	@Autowired
	private OrderProducer orderProducer;
	
    public String sendOrder(OrderDto order) throws JsonProcessingException {
        return orderProducer.send(order);
    }
	
}

This is the code flow for sending data but we do need to do some configuration for Kafka. Let's start with application.yml file where we'll add the Kafka bootstrap servers and the topic name.

server:
  port: 8081
  
spring:
  application:
    name: order-service

  kafka:
    bootstrap-servers: localhost:9092  
    topic:
      name: order-topic

With bootstrap-servers property you can provided a comma separated list of host/port pairs to use for establishing the initial connection to the Kafka cluster. Here we have only a single server.

Producer Configuration

You can provide producer configuration in the application.yml file or create a Java class annotated with @Configuration and provide configuration there. I prefer the latter though with properties file it will look something like this.

spring:
  kafka:
    producer:
      bootstrap-servers: localhost:9092
      key-serializer: org.apache.kafka.common.serialization.StringSerializer
      value-serializer: org.springframework.kafka.support.serializer.JsonSerializer
      acks: all
    topic:
      name: order-topic

Here is the OrderProducerConfig.java class that is used in this example to provide producer configuration.

import org.apache.kafka.clients.admin.NewTopic;
import org.apache.kafka.clients.producer.ProducerConfig;
import org.apache.kafka.common.serialization.ByteArraySerializer;
import org.apache.kafka.common.serialization.StringSerializer;
import org.springframework.beans.factory.annotation.Value;
import org.springframework.context.annotation.Bean;
import org.springframework.context.annotation.Configuration;
import org.springframework.kafka.core.KafkaTemplate;
import org.springframework.kafka.core.ProducerFactory;
import org.springframework.kafka.config.TopicBuilder;
import org.springframework.kafka.core.DefaultKafkaProducerFactory;

@Configuration
public class OrderProducerConfig {
  @Value("${spring.kafka.bootstrap-servers}")
  private String bootstrapServers;
  @Value("${spring.kafka.topic.name}")
  private String topicName;

    @Bean
    public Map<String, Object> producerConfig() {
      Map<String, Object> props = new HashMap<>();
        props.put(ProducerConfig.BOOTSTRAP_SERVERS_CONFIG, bootstrapServers);
        props.put(ProducerConfig.KEY_SERIALIZER_CLASS_CONFIG, StringSerializer.class);
        props.put(ProducerConfig.VALUE_SERIALIZER_CLASS_CONFIG, ByteArraySerializer.class);
        props.put(ProducerConfig.LINGER_MS_CONFIG, 2);
        props.put(ProducerConfig.ACKS_CONFIG, "all");
        props.put(ProducerConfig.REQUEST_TIMEOUT_MS_CONFIG, 60000);
        props.put(ProducerConfig.RETRIES_CONFIG, 3);
        return props;
    }
    
    @Bean
    public ProducerFactory<String, Object> producerFactory(){
        return new DefaultKafkaProducerFactory<>(producerConfig());
    }
    
    @Bean
    public KafkaTemplate<String, Object> kafkaTemplate() {
        return new KafkaTemplate<>(producerFactory());
    }

    @Bean
    public NewTopic topic() {
        return TopicBuilder
                .name(topicName)
                .partitions(1)
                .replicas(1)
                .build();
    }
}

Description for the configuration values provided for the Kafka producers are as given below-

KEY_SERIALIZER_CLASS_CONFIG- Serializer class for key

VALUE_SERIALIZER_CLASS_CONFIG- Serializer class for value

LINGER_MS_CONFIG- Using this configuration you can delay the sending of records rather than sending them immediately. Producer waits for the given duration and group the records arriving during that time to send them together.

ACKS_CONFIG- The number of acknowledgments the producer requires the leader to have received before considering a request complete. acks=all means the leader will wait for the full set of in-sync replicas to acknowledge the record.

REQUEST_TIMEOUT_MS_CONFIG- The configuration controls the maximum amount of time the client will wait for the response of a request.

RETRIES_CONFIG- Setting a value greater than zero will cause the client to resend any record whose send fails.

Using these configurations DefaultKafkaProducerFactory creates a singleton shared Producer instance.

KafkaTemplate is a template for executing high-level operations. When used with a DefaultKafkaProducerFactory, the template is thread-safe.

A NewTopic instance is also created by passing the topic name which was configured in the application.yml file.

OrderProducer class

For sending message to a specific topic using KafkaTemplate is done in a separate OrderProducer class. ObjectMapper class' writeValueAsBytes() method is used to serialize Order object to byte array.

import org.apache.kafka.clients.admin.NewTopic;
import org.springframework.kafka.core.KafkaTemplate;
import org.springframework.stereotype.Component;
import com.fasterxml.jackson.core.JsonProcessingException;
import com.fasterxml.jackson.databind.ObjectMapper;
import com.netjstech.orderservice.dto.OrderDto;
import lombok.extern.slf4j.Slf4j;

@Slf4j
@Component
public class OrderProducer {
  private final KafkaTemplate<String, Object> kafkaTemplate;
  private final NewTopic topicName;
  private final ObjectMapper objectMapper;

  public OrderProducer(NewTopic topic, KafkaTemplate<String, Object> kafkaTemplate, ObjectMapper objectMapper) {
    this.topicName = topic;
    this.kafkaTemplate = kafkaTemplate;
    this.objectMapper = objectMapper;
  }

  public String send(OrderDto order) throws JsonProcessingException {     
    log.info("Sending message='{}' to topic='{}'", order.toString(), topicName);                 
    
    kafkaTemplate.send(topicName.name(), objectMapper.writeValueAsBytes(order));
    return "message sent";
  }
}

That concludes the Producer part before moving to the Consumer part let's see how to install Apache Kafka.

Installing Kafka

Simplest way to get Kafka is to run it as a container, here is a docker-compose.yml file that can be used to do that.

version: "3"

services:
  kafka:
    image: docker.io/bitnami/kafka:3.6
    ports:
      - "9092:9092"
    container_name: broker
    volumes:
      - "kafka_data:/bitnami"
    environment:
      # KRaft settings
      - KAFKA_ENABLE_KRAFT=yes
      - KAFKA_CFG_NODE_ID=0
      - KAFKA_CFG_PROCESS_ROLES=controller,broker
      - KAFKA_CFG_CONTROLLER_QUORUM_VOTERS=0@kafka:9093
      # Listeners
      - KAFKA_CFG_LISTENERS=PLAINTEXT://:9092,CONTROLLER://:9093
      - KAFKA_CFG_ADVERTISED_LISTENERS=PLAINTEXT://127.0.0.1:9092
      - KAFKA_CFG_LISTENER_SECURITY_PROTOCOL_MAP=CONTROLLER:PLAINTEXT,PLAINTEXT:PLAINTEXT
      - KAFKA_CFG_CONTROLLER_LISTENER_NAMES=CONTROLLER
      - KAFKA_CFG_INTER_BROKER_LISTENER_NAME=PLAINTEXT
volumes:
  kafka_data:
    driver: local

Note that Kafka 3.3.1. onward Zookeeper is not required to store metadata about Kafka cluster. Apache Kafka Raft (KRaft) simplifies Kafka's architecture by consolidating responsibility for metadata into Kafka itself, rather than splitting it between two different systems: ZooKeeper and Kafka. That is why Zookeeper instance is not configured in the compose file.

Also note that the port in bootstrap-servers you provided in service (9092) matches the port in your compose file.

To build and start the container use the following command

docker compose up -d

-d switch to run it in detached mode.

After that you can use docker compose stop and docker compose start to stop and start these containers.

Just ensure that all the containers are up by running the following command.

docker ps -a

order-consumer-service Microservice

In STS create a new Spring Starter Project and give details as given here.

Name: order-consumer-service. Java version used is 17, packaging is Jar and project type is Maven. Dependencies are same as given in order-service.

Configuration properties

Since consumer needs to read the data written by producer so topic name for consumer should be same as producer.

application.yml

server:
  port: 8082
    
spring:
  application:
    name: order-consumer-service

  kafka:
    bootstrap-servers: localhost:9092  
    topic:
      name: order-topic

OrderDto class

POJO class used to produce and consume data. This class is same as in order-service.

import java.util.List;
import lombok.AllArgsConstructor;
import lombok.Builder;
import lombok.Data;
import lombok.NoArgsConstructor;

@Builder
@Data
@NoArgsConstructor
@AllArgsConstructor
public class OrderDto {
  private List<String> items;
  private double amount;
  private String status;
}

Consumer Configuration

A Java configuration class which provides consumer configuration.

import java.util.HashMap;
import java.util.Map;

import org.apache.kafka.clients.consumer.ConsumerConfig;
import org.apache.kafka.common.serialization.ByteArrayDeserializer;
import org.apache.kafka.common.serialization.StringDeserializer;
import org.springframework.beans.factory.annotation.Value;
import org.springframework.context.annotation.Bean;
import org.springframework.context.annotation.Configuration;
import org.springframework.kafka.config.ConcurrentKafkaListenerContainerFactory;
import org.springframework.kafka.config.KafkaListenerContainerFactory;
import org.springframework.kafka.core.ConsumerFactory;
import org.springframework.kafka.core.DefaultKafkaConsumerFactory;
import org.springframework.kafka.listener.ConcurrentMessageListenerContainer;
import org.springframework.kafka.support.serializer.JsonDeserializer;

@Configuration
public class OrderConsumerConfig {
  @Value("${spring.kafka.bootstrap-servers}")
  private String bootstrapServers;
  @Value("${spring.kafka.topic.name}")
  private String topicName;
  
    @Bean
    public Map<String, Object> consumerConfig() {
      Map<String, Object> props = new HashMap<>();
        props.put(ConsumerConfig.BOOTSTRAP_SERVERS_CONFIG, bootstrapServers);
        props.put(ConsumerConfig.GROUP_ID_CONFIG, "order");
        props.put(ConsumerConfig.KEY_DESERIALIZER_CLASS_CONFIG, StringDeserializer.class);
        props.put(ConsumerConfig.VALUE_DESERIALIZER_CLASS_CONFIG, ByteArrayDeserializer.class);
        return props;
    }
    
    @Bean
    public ConsumerFactory<String, Object> consumerFactory(){
        return new DefaultKafkaConsumerFactory<>(consumerConfig());
    }
    
    @Bean
    public KafkaListenerContainerFactory<ConcurrentMessageListenerContainer<String, Object>> kafkaListenerContainerFactory(){
        ConcurrentKafkaListenerContainerFactory<String, Object> factory = new ConcurrentKafkaListenerContainerFactory<>();
        factory.setConsumerFactory(consumerFactory());
        return factory;
    }
}

Note the use of ConsumerConfig.GROUP_ID_CONFIG in the class which sets the consumer group ID. The Group ID determines which consumers belong to which group. If there are four consumers with the same Group ID assigned to the same topic, they will all share the work of reading from the same topic.

You can use a particular Group ID's offset to check whether there's been new data written to the partition. If there's an event with a larger offset, that means there's new data to read. If there are more consumers with the same group ID and same topic then any one of them can read the new data which is the functionality you may want. In our example which passes order, more consumers having the same group ID will work. Any order is read by only a single consumer. But there are scenarios where you may not want that, in that case group IDs for the consumer should not be same.

Using these configurations DefaultKafkaConsumerFactory produces new Consumer instances.

ConcurrentKafkaListenerContainerFactory is a KafkaListenerContainerFactory implementation to build a ConcurrentMessageListenerContainer. This factory is primarily for building containers for KafkaListener annotated methods but can also be used to create any container.

OrderConsumerService

Service class that has a method annotated with @KafkaListener which marks a method to be the target of a Kafka message listener on the specified topics. With @KafkaListener annotation we can specify a topic.

import java.io.IOException;

import org.springframework.kafka.annotation.KafkaListener;
import org.springframework.stereotype.Service;
import com.fasterxml.jackson.databind.ObjectMapper;
import com.netjstech.orderconsumerservice.dto.OrderDto;

import lombok.extern.slf4j.Slf4j;

@Service
@Slf4j
public class OrderConsumerService {
  private final ObjectMapper objectMapper;
  public OrderConsumerService(ObjectMapper objectMapper) {
    this.objectMapper = objectMapper;
  }
  
  @KafkaListener(topics = "${spring.kafka.topic.name}")
  public void orderConsumer(byte[] message) throws IOException {
    OrderDto order = objectMapper.readValue(message, OrderDto.class);
    log.info("Order data- " + order.toString());
    // Order status can be changed once it fulfills some criteria
    order.setStatus("Processed");
    log.info("Order data- " + order.toString());
  }
}

Testing Kafka and microservices integration

Start both the Services and also ensure Kafka container is up. Using Postman send an order to the order-service listening on port 8081

Spring Boot Kafka Example

Once the order is sent to order-service it should be written to the configured topic by Kafka. Consumer reads the Order data from topic then you can further process the order by doing payment and changing the status to processed or rejected based on whether payment was successful or failed and pass that event to another microservice for further processing of order.

In the order-consumer-service you can verify the logs to see that the order is read by the consumer.

[2m2023-12-27T14:06:46.182+05:30 INFO 17940 --- [order-consumer-service] [ntainer#0-0-C-1] c.n.o.service.OrderConsumerService : Order data- OrderDto(items=[RAM, Laptop, Mouse], amount=725.5, status=ordered)
[2m2023-12-27T14:06:46.182+05:30 INFO 17940 --- [order-consumer-service] [ntainer#0-0-C-1] c.n.o.service.OrderConsumerService : Order data- OrderDto(items=[RAM, Laptop, Mouse], amount=725.5, status=Processed)

Reference: https://kafka.apache.org/documentation

That's all for this topic Spring Boot Event Driven Microservice With Kafka. If you have any doubt or any suggestions to make please drop a comment. Thanks!

>>>Return to Spring Tutorial Page


Related Topics

  1. Spring Boot Microservice + API Gateway + Resilience4J
  2. Spring Boot Observability - Distributed Tracing, Metrics
  3. Spring Boot Microservice - Externalized Configuration With Spring Cloud Config
  4. Spring Boot Microservice - Load-Balancing With Spring Cloud LoadBalancer
  5. Spring Boot Microservice Circuit Breaker Using Resilience4j

You may also like-

  1. Spring MVC Excel Generation Example
  2. Spring JdbcTemplate Insert, Update And Delete Example
  3. BeanPostProcessor in Spring Framework
  4. Spring Object XML Mapping (OXM) JAXB Example
  5. Is String Thread Safe in Java
  6. Java Concurrency Interview Questions And Answers
  7. JavaScript Rest Parameter
  8. Angular Reactive Form Example

Wednesday, February 28, 2024

Spring Boot Observability - Distributed Tracing, Metrics

In this post we'll see how to set up distributed tracing for Spring Boot microservices. With Spring Boot 3, observability support has been added to Spring applications and that's what we'll use in this post which means setting up observability in Spring Boot microservices with Micrometer and Grafana Stack (Loki, Prometheus, Tempo).

What is Observability

Observability is the process of understanding the internals of your system by examining the outputs of the application, where the output entails logs, metrics and distributed tracing. By observing these outputs, you can get an idea about the state of the system like exceptions thrown, latency in applications.

Spring Boot Observability with Grafana Stack

You can observe the Spring Boot application with the applications provided as part of Grafana stack.

  1. Traces with Tempo and OpenTelemetry or Zipkin
  2. Metrics with Prometheus, Spring Boot Actuator, and Micrometer
  3. Logs with Loki and Logback

Let's get some idea about these applications.

Loki- Loki is a horizontally-scalable, highly-available log aggregation system. Since the stack we are using puts Micrometer Tracing on the classpath, the logs are automatically correlated (i.e. contain a unique trace identifier). Loki is the server for storing the logs and processing queries.

Logback- Logback is a logging framework, using it you can configure how to send logs to Loki and the pattern (that includes traceID) for logs.

Tempo- Grafana Tempo is an open source, easy-to-use and high-scale distributed tracing backend.

Tempo is Jaeger, Zipkin, Kafka, OpenCensus and OpenTelemetry compatible. It ingests batches in any of the mentioned formats, buffers them and then writes them to Azure, GCS, S3 or local disk.

Prometheus- Prometheus is the metrics aggregation system. Metrics is some kind of measurement for example, time taken for processing request by a web server, number of active connections in a database.

Prometheus collects and stores its metrics as time series data, i.e. metrics information is stored with the timestamp at which it was recorded, alongside optional key-value pairs called labels.

Micrometer- Micrometer provides a simple facade over the instrumentation clients, allowing you to instrument your JVM-based application code without vendor lock-in.

Micrometer provides libraries for connecting to Prometheus for Micrometer metrics.

For tracing context propagation Micrometer provides libraries to connect to Zipkin or OpenTelemetry.

Grafana- Grafana acts as a one stop shop for connecting to the data sources. There is Loki with logging data, Prometheus with metrics data and Tempo with tracing data, all these data sources are connected to Grafana to get meaningful insight at a single location.

With Grafana you can easily query, visualize, set up alerts and analyze the data with the help of metrics

Span and Traces

With observability two terms you will hear a lot are span and traces so let's try to get some clarity about these terms.

To serve a request, from an end user, processing may span several microservices, where one microservice calls another and so on.

Each call from one service to the another is called a span.

Trace is the sum total of all the spans involved in processing of a single request.

For example, if end user requests to get customer data that call goes to customer-service to get customer data and to account-service to get associated accounts.

Span and Trace in distributed tracing

As you can see from the image with each request span ID and trace ID are also assigned. If there is a call from one microservice to another that call span is assigned a different span ID but trace ID remains same. Each service passes the trace ID to the next service in order to facilitate the distributed tracing.

Some other terms related to distributed tracing are as given below-

Tracer- A library that handles the lifecycle of a span.

Tracing context- For distributed tracing to work the tracing context (trace id, span id, etc.) must be propagated through the process and over the network.

Log correlation- Parts of the tracing context (e.g. trace id, span id) can be populated to the logs of a given application. One can then collect all logs in a single storage and group them via trace id. That way one can get all logs, for a single business operation (trace) from all services put in a chronological order.

Latency analysis tools- A tool that collects exported spans and visualizes the whole trace.

Spring Boot observability example

To set up observability which involves distributed tracing, logs and metrics we'll use the example used in Spring Boot Microservice - Service Registration and Discovery With Eureka as our base example and make changes to it to add observability.

In the example we'll have two services CustomerService and AccountService to cater to customer and account related functionalities respectively. When customer information is retrieved it should also get the accounts associated with the specific customer. For getting the associated accounts for a customer we'll have to make a call from CustomerService to AccountService.

Adding maven dependencies

Need to add the following dependencies in the pom.xml of both Customer-Service and Account-Service.

<dependency>
  <groupId>com.github.loki4j</groupId>
  <artifactId>loki-logback-appender</artifactId>
  <version>1.4.2</version>
</dependency>
<dependency>
  <groupId>org.springframework.boot</groupId>
  <artifactId>spring-boot-starter-actuator</artifactId>
</dependency>
<dependency>
  <groupId>io.micrometer</groupId>
  <artifactId>micrometer-registry-prometheus</artifactId>
</dependency>
<dependency>
  <groupId>io.micrometer</groupId>
  <artifactId>micrometer-tracing-bridge-brave</artifactId>
</dependency>
<dependency>
  <groupId>io.zipkin.reporter2</groupId>
  <artifactId>zipkin-reporter-brave</artifactId>
</dependency>

com.github.loki4j:loki-logback-appender dependency is required to send the logs to Loki.

io.micrometer:micrometer-tracing-bridge-brave is a dependency to add Zipkin Brave which is a tracer bridge for Tracing Context Propagation with Micrometer Tracing.

There is also an OpenTelemetry tracer available in case you are using OpenTelementry. Then the dependency would be-

<dependency>
  <groupId>io.micrometer</groupId>
  <artifactId>micrometer-tracing-bridge-otel</artifactId>
</dependency>

io.zipkin.reporter2:zipkin-reporter-brave dependency is needed to produce Zipkin-compliant span. These formatted finished spans are needed for Latency Visualization. In case you are using OpenTelemetry then the dependency would be.

<dependency>
  <groupId>io.opentelemetry</groupId>
  <artifactId>opentelemetry-exporter-zipkin</artifactId>
</dependency>

io.micrometer:micrometer-registry-prometheus dependency is needed for Micrometer metrics with Prometheus

Adding Configuration

Add the following properties in the application.yml file.

management:
  endpoint:
    health:
      show-details: always
  endpoints:
    web:
      exposure:
        include: health, metrics, prometheus
  metrics:
    distribution:
      percentiles-histogram:
        http:
          server:
            requests: true
  tracing:
    sampling:
      probability : 1.0         
 
logging:
  pattern:
    level: "%5p [${spring.application.name:},%X{traceId:-},%X{spanId:-}]"

management.endpoints.web.exposure.include property exposes the mentioned endpoints (health, metrics and prometheus) through the actuator.

logging.pattern.level property is needed to add trace ID and span ID to the logs

management.tracing.sampling.probability is set to 1 so that all the traces are sent to latency analysis tool. By default, Spring Boot samples only 10% of requests to prevent overwhelming the trace backend. This property switches it to 100% so that every request is sent to the trace backend.

management.metrics.distribution.percentiles-histogram.http.server.requests=true property means Micrometer accumulates values to an underlying histogram and ships a predetermined set of buckets to the monitoring system. This helps in collectiong data to observe histogram-based percentile distributions.

/src/main/resources/logback-spring.xml

This XML file is needed to configure the loki-logback-appender to send logs to the local instance of Loki.

<?xml version="1.0" encoding="UTF-8"?>
<configuration>
  <include resource="org/springframework/boot/logging/logback/base.xml" />
  <springProperty scope="context" name="appName" source="spring.application.name"/>

  <appender name="LOKI" class="com.github.loki4j.logback.Loki4jAppender">
    <http>
      <url>http://localhost:3100/loki/api/v1/push</url>
    </http>
    <format>
      <label>
        <pattern>app=${appName},host=${HOSTNAME},traceID=%X{traceId:-NONE},level=%level</pattern>
      </label>
      <message>
        <pattern>${FILE_LOG_PATTERN}</pattern>
      </message>
      <sortByTime>true</sortByTime>
    </format>
  </appender>

  <root level="INFO">
    <appender-ref ref="LOKI"/>
  </root>
</configuration>

RestTemplate Config

We need a RestTemplate bean that is automatically instrumented by Spring Boot. Construct a RestTemplate instance from the RestTemplateBuilder.

import org.springframework.boot.web.client.RestTemplateBuilder;
import org.springframework.cloud.client.loadbalancer.LoadBalanced;
import org.springframework.context.annotation.Bean;
import org.springframework.context.annotation.Configuration;
import org.springframework.web.client.RestTemplate;

@Configuration
public class TemplateConfig {
	
  @Bean 
  @LoadBalanced
  RestTemplate restTemplate(RestTemplateBuilder builder) { 
    return builder.build(); 
  }
}

Putting Log statements

Do add few log statements in the Controller and Service classes.

For example, in CustomerController add the @Slf4j annotation at the class level then add log statement in the method getCustomerById().

@GetMapping("/{id}")
public ResponseEntity<CustomerDto> getCustomerById(@PathVariable("id") Long customerId){
  log.info("Getting data for customer with id {}", customerId);
  
  CustomerDto customer = customerService.getCustomerById(customerId);
  
  return ResponseEntity.ok(customer);
}

Adding log statements in CustomerServiceImpl

@Override
public CustomerDto getCustomerById(Long id) {
  Customer customer = customerRepository.findById(id)
               .orElseThrow(()-> new CustomerServiceException("No customer found for the given id - " + id));
  log.info("Calling Account Service to get account data for customer with id {}", id);
  ResponseEntity<List<AccountDto>> response = restTemplate.exchange("http://ACCOUNT-SERVICE/account/customer/"+id, HttpMethod.GET, null, 
      new ParameterizedTypeReference<List<AccountDto>>(){});
  List<AccountDto> accounts = response.getBody();
  CustomerDto customerDto = CustomerDto.builder()
         .id(customer.getId())
         .name(customer.getName())
         .age(customer.getAge())
         .city(customer.getCity())
         .accounts(accounts)
         .build();
  return customerDto;
}

Same way you can add log statements in AccountController and AccountServiceImpl in the account-service.

Installing Loki, Tempo, Prometheus and Grafana

It's easy to install and run these applications using Docker. Here is a docker-compose.yml file that downloads images and run these applications.

version: "3"

services:
  tempo:
    image: grafana/tempo:latest
    command: [ "-config.file=/etc/tempo.yaml" ]
    volumes:
      - ./docker/tempo/tempo-local.yml:/etc/tempo.yaml:ro
      - ./tempo-data:/tmp/tempo
    ports:
      - "3200:3200" # tempo
      - "9411:9411" # zipkin
          
  loki:
    image: grafana/loki:latest
    ports:
      - "3100:3100"
    command: [ "-config.file=/etc/loki/local-config.yaml" ]
  
  prometheus:
    image: prom/prometheus:latest
    command:
      - --enable-feature=exemplar-storage
      - --config.file=/etc/prometheus/prometheus.yml
    volumes:
      - ./docker/prometheus/prometheus.yml:/etc/prometheus/prometheus.yml:ro
    ports:
      - "9090:9090"
      
  grafana:
    image: grafana/grafana:latest
    volumes:
      - ./docker/grafana/provisioning/datasources:/etc/grafana/provisioning/datasources:ro
      - ./docker/grafana/provisioning/dashboards:/etc/grafana/provisioning/dashboards:ro
    environment:
      - GF_AUTH_ANONYMOUS_ENABLED=true
      - GF_AUTH_ANONYMOUS_ORG_ROLE=Admin
      - GF_AUTH_DISABLE_LOGIN_FORM=true
    ports:
      - "3000:3000"

If you notice in the docker-compose file certain configuration files are set up under volumes so we need to create those files. With in the current directory (directory where docker-compose file is residing) create a directory "docker" and then create the following files.

For Grafana if you notice authorization is disabled by the environment parameter passed, which is ok for local testing but not otherwise.

/docker/tempo/tempo-local.yml

server:
    http_listen_port: 3200

distributor:
    receivers:
        zipkin:

storage:
    trace:
        backend: local
        local:
            path: /tmp/tempo/blocks

/docker/grafana/provisioning/datasources/datasource.yml

This configuration file gives information about the available data sources like Loki, Prometheus, Tempo. Note the use of host.docker.internal, which resolves to the internal IP address used by the host. Using it you can connect from a container to a service on the host.

apiVersion: 1

datasources:
  - name: Prometheus
    type: prometheus
    access: proxy
    url: http://host.docker.internal:9090
    editable: false
    jsonData:
      httpMethod: POST
      exemplarTraceIdDestinations:
        - name: trace_id
          datasourceUid: tempo
  - name: Tempo
    type: tempo
    access: proxy
    orgId: 1
    url: http://tempo:3200
    basicAuth: false
    isDefault: true
    version: 1
    editable: false
    apiVersion: 1
    uid: tempo
    jsonData:
        httpMethod: GET
        tracesToLogs:
            datasourceUid: 'loki'
  - name: Loki
    type: loki
    uid: loki
    access: proxy
    orgId: 1
    url: http://loki:3100
    basicAuth: false
    isDefault: false
    version: 1
    editable: false
    apiVersion: 1
    jsonData:
      derivedFields:
        - datasourceUid: tempo
          matcherRegex: \[.+,(.+?),
          name: TraceID
          url: $${__value.raw}

/docker/grafana/provisioning/dashboards/dashboard.yml

apiVersion: 1

providers:
  - name: dashboards
    type: file
    disableDeletion: true
    editable: true
    options:
      path: /etc/grafana/provisioning/dashboards
      foldersFromFilesStructure: true

/docker/prometheus/prometheus.yml

global:
  scrape_interval: 2s
  evaluation_interval: 2s

scrape_configs:
  - job_name: 'prometheus'
    static_configs:
        - targets: ['host.docker.internal:9090']
  #- job_name: 'apps'
    #metrics_path: '/actuator/prometheus'
    #static_configs:
      #- targets: ['host.docker.internal:8081','host.docker.internal:8082']
      
  - job_name: 'eureka'
    metrics_path: '/actuator/prometheus'
    # Scrape Eureka itself to discover new services.
    eureka_sd_configs:
      - server: http://host.docker.internal:8761/eureka

A scrape_config section specifies a set of targets and parameters describing how to scrape them. Targets may be statically configured via the static_configs parameter or dynamically discovered using one of the supported service-discovery mechanisms.

In the above .yml file Services are discovered dynamically as the services are already registered with Eureka server, so no need to hardcode service URLs. Eureka service discovery is done using eureka_sd_configs parameter. static_configs section is also given (which is commented) for better understanding.

Testing the Spring Boot Observability

Running the Grafana Stack

For testing our setup first thing is to start all the services. For that run the following command by going to the location where you have your docker-compose file.

docker compose up -d

-d switch to run it in detached mode.

This command builds and starts the containers. After that you can use docker compose stop and docker compose start to stop and start these containers.

Just ensure that all the containers are up by running the following command.

Docker ps -a
docker compose Grafana stack

If there is any problem with any of the containers, please check the docker logs for the same.

Running the MicroServices

Also start the eureka-discovery-service, customer-service and account-service. Try to access customer data- http://localhost:8081/customer/1

Accessing Grafana

To access Grafana go to http://localhost:3000/

Select explore by clicking toggle menu on the left-hand side.

From the dropdown select Loki to view the aggregated logs.

Grafana Explore

In the label filter you have options like filter by app, host, level, trace ID

If you select app and then select customer-service and then run the query

Grafana Loki

Verify the logs and notice the trace ID.

2023-12-19T11:02:07.917+05:30  INFO [customer-service,65812ad785d60e30c67cc73d94e07aa0,c67cc73d94e07aa0] 22188 --- [http-nio-8081-exec-2] c.n.c.service.CustomerServiceImpl        : Calling Account Service to get account data for customer with id 1
2023-12-19T11:02:07.743+05:30  INFO [customer-service,65812ad785d60e30c67cc73d94e07aa0,c67cc73d94e07aa0] 22188 --- [http-nio-8081-exec-2] c.n.c.controller.CustomerController      : Getting data for customer with id 1

For me trace ID is 65812ad785d60e30c67cc73d94e07aa0

If I select app as account-service and then run the query. On verifying the logs, trace ID is same for the same request though the span ID differs. That way logs from different microservices can be corelated by trace ID.

2023-12-19 11:06:29.800	
2023-12-19T11:06:29.800+05:30  INFO [account-service,,] 16160 --- [AsyncResolver-bootstrap-executor-0] c.n.d.s.r.aws.ConfigClusterResolver      : Resolving eureka endpoints via configuration
2023-12-19T11:02:08.342+05:30  INFO [account-service,65812ad785d60e30c67cc73d94e07aa0,3434618310164a97] 16160 --- [http-nio-8082-exec-1] c.n.a.controller.AccountController       : Getting account data for customer with id 1

Copy the trace ID and go back to explore and select Tempo. Paste the copied trace ID and you can see that you have the information about the spans with in the same trace and the time spent.

Grafana Tempo

Same way you can go to Prometheus and select the job as "Eureka" to see the activity around this service.

By accessing http://localhost:8081/actuator/prometheus you can get the list of metrics exposed by actuator.

Reference: https://spring.io/blog/2022/10/12/observability-with-spring-boot-3

That's all for this topic Spring Boot Observability - Distributed Tracing, Metrics. If you have any doubt or any suggestions to make please drop a comment. Thanks!

>>>Return to Spring Tutorial Page


Related Topics

  1. Spring Boot Microservice + API Gateway + Resilience4J
  2. Spring Boot Microservice - Externalized Configuration With Spring Cloud Config
  3. Spring Boot Microservice - Load-Balancing With Spring Cloud LoadBalancer
  4. Spring Boot Event Driven Microservice With Kafka
  5. Spring Boot - spring-boot-starter-parent

You may also like-

  1. Spring MVC Excel Generation Example
  2. Spring MVC - Binding List of Objects Example
  3. Connection Pooling Using C3P0 Spring Example
  4. BeanFactoryAware Interface in Spring Framework
  5. How to Use ngFor and ngIf in Same Element in Angular
  6. Java CyclicBarrier With Examples
  7. Convert Numbers to Words Java Program
  8. React Declarative Approach

Tuesday, February 27, 2024

Spring Boot Microservice + API Gateway + Resilience4J

In this post we'll see how to configure API Gateway in Microservices using Spring Cloud Gateway with Eureka as service registry and Resilience4J as circuit breaker.

Spring Cloud Gateway

Spring Cloud Gateway project provides an API Gateway which acts as a front for routing to different microservices.

Spring Cloud Gateway

Spring Cloud Gateway is built on Spring Boot, Spring WebFlux, and Project Reactor. Spring Cloud Gateway requires the Netty runtime provided by Spring Boot and Spring Webflux. It does not work in a traditional Servlet Container or when built as a WAR. Therefore, you'll see the Gateway service starting on a Netty server rather than on a Tomcat server which is used for Spring Boot web applications by default.

  1. Route: It is the basic building block of the gateway. It is defined by an ID, a destination URI, a collection of predicates, and a collection of filters. A route is matched if the aggregate predicate is true and forwards the request to the destination URI.
  2. Predicate: This is a Java 8 Function Predicate. The input type is a Spring Framework ServerWebExchange. This lets you match on anything from the HTTP request, such as headers or parameters.
  3. Filter: These are instances of GatewayFilter that have been constructed with a specific factory. Used to modify requests and responses and apply features such as rate limiting, circuit breaker before or after sending the downstream request.

Advantages of using API gateway

  1. API gateway sits between an external client and multiple microservices and acts as a single entry & exit point. That makes gateway as a single implementation point to provide cross cutting concerns to all the microservices such as security (Initial authentication), monitoring/metrics, and resiliency (circuit breaker, rate limiting).
  2. Client doesn’t need to know about all the backend services. They need to communicate only with API gateway.

Spring Boot Microservice with API Gateway example

In this example we'll configure an API Gateway, register it as a service with Eureka and also configure Resilience4J as circuit breaker at the gateway level.

We'll use the example used in this post as a base example- Spring Boot Microservice - Service Registration and Discovery With Eureka with that you should have CustomerService and AccountService ready and registered with Eureka.

Creating Gateway Service

Gateway service is created as a separate microservice. If you are using Spring Tool Suite then create a new Spring Starter Project and name it gateway-service.

Select "Gateway" as dependency under "Spring Cloud Routing". Select "Resilience4J" under "Spring Cloud Circuit Breaker" and "Eureka Discovery Client" under "Spring Cloud Discovery".

With that the created pom.xml should look like this-

<?xml version="1.0" encoding="UTF-8"?>
<project xmlns="http://maven.apache.org/POM/4.0.0" xmlns:xsi="http://www.w3.org/2001/XMLSchema-instance"
  xsi:schemaLocation="http://maven.apache.org/POM/4.0.0 https://maven.apache.org/xsd/maven-4.0.0.xsd">
  <modelVersion>4.0.0</modelVersion>
  <parent>
    <groupId>org.springframework.boot</groupId>
    <artifactId>spring-boot-starter-parent</artifactId>
    <version>3.1.2</version>
    <relativePath/> <!-- lookup parent from repository -->
  </parent>
  <groupId>com.netjstech</groupId>
  <artifactId>gatewayservice</artifactId>
  <version>0.0.1-SNAPSHOT</version>
  <name>gateway-service</name>
  <description>Cloud Gateway Service</description>
  <properties>
    <java.version>17</java.version>
    <spring-cloud.version>2022.0.4</spring-cloud.version>
  </properties>
  <dependencies>
    <dependency>
      <groupId>org.springframework.cloud</groupId>
      <artifactId>spring-cloud-starter-gateway</artifactId>
    </dependency>
    <dependency>
      <groupId>org.springframework.cloud</groupId>
      <artifactId>spring-cloud-starter-netflix-eureka-client</artifactId>
    </dependency>

    <dependency>
      <groupId>org.springframework.boot</groupId>
      <artifactId>spring-boot-starter-test</artifactId>
      <scope>test</scope>
    </dependency>
    <dependency>
      <groupId>org.springframework.boot</groupId>
      <artifactId>spring-boot-starter-actuator</artifactId>
    </dependency>
    <dependency>
         <groupId>org.springframework.cloud</groupId>
         <artifactId>spring-cloud-starter-circuitbreaker-reactor-resilience4j</artifactId>
    </dependency>
    <dependency>
      <groupId>org.springframework.boot</groupId>
      <artifactId>spring-boot-devtools</artifactId>
      <scope>runtime</scope>
      <optional>true</optional>
    </dependency>
  </dependencies>
  <dependencyManagement>
    <dependencies>
      <dependency>
        <groupId>org.springframework.cloud</groupId>
        <artifactId>spring-cloud-dependencies</artifactId>
        <version>${spring-cloud.version}</version>
        <type>pom</type>
        <scope>import</scope>
      </dependency>
    </dependencies>
  </dependencyManagement>

  <build>
    <plugins>
      <plugin>
        <groupId>org.springframework.boot</groupId>
        <artifactId>spring-boot-maven-plugin</artifactId>
      </plugin>
    </plugins>
  </build>

</project>
  • Eureka client is needed because gateway-service will be registered with Eureka server.
  • Resilience4J is needed to implement circuit breaker functionality as gateway level.
  • Actuator is needed to see metrics for circuit breaker.
  • Of course, cloud-starter-gateway is needed since we are implementing an API gateway.

Application class with @EnableDiscoveryClient annotation

import org.springframework.boot.SpringApplication;
import org.springframework.boot.autoconfigure.SpringBootApplication;
import org.springframework.cloud.client.discovery.EnableDiscoveryClient;

@SpringBootApplication
@EnableDiscoveryClient
public class GatewayServiceApplication {

	public static void main(String[] args) {
		SpringApplication.run(GatewayServiceApplication.class, args);
	}
}

API Gateway configuration

You can configure gateway using config or code. Here it is done using config in application.yml file.

server:
  port: 8181
  
eureka:
  client:
    serviceUrl:
      defaultZone: http://localhost:8761/eureka
  
management:
  endpoint:
    health:
      show-details: always
  endpoints:
    web:
      exposure:
        include: health
  health:
    circuitbreakers:
      enabled: true
 
resilience4j.circuitbreaker:
  configs:
    default:
      registerHealthIndicator: true
      
spring:
  application:
    name: gateway-service
  cloud:
    gateway:
      discovery:
        locator:
          enabled: false
          lower-case-service-id: true
      routes:
        - id: customer-service
          uri: http://localhost:8081 #lb://customer-service
          predicates:
            - Path=/customer/**
          filters:
            - name: CircuitBreaker
              args:
                name: CusCircuitBreaker
                fallbackUri: forward:/fallback/customer
        - id: account-service
          uri: lb://account-service
          predicates:
            - Path=/account/**   
          filters:
            - name: CircuitBreaker
              args:
                name: AcctCircuitBreaker
                fallbackUri: forward:/fallback/account

If we go over the configuration properties from the beginning of the file.

  • Netty server, this service starts on, listens on the port 8181.
  • Next there is configuration for actuator so that metrics for circuit breaker is also accessible when http://localhost:8181/actuator/health is accessed.
  • Properties for gateway starts from routes which has a id, a destination URI to which the request is forwarded when the predicate matches.
  • Predicate has a wildcard which means URLs having anything after /customer/ or /account/ should be matched with these predicates.
  • Here note that URI for customer-service is a direct URL (a static route) where as for account-service it is lb://account-service which means a load balanced instance.
  • Since we are also configuring circuit breaker that configuration is provided using filters. A fallback URI is configured here and that path is mapped to a method in Controller. This method is called as a fallback when service is not available and circuit is open.

Gateway Fallback Controller

import org.springframework.http.HttpStatus;
import org.springframework.http.ResponseEntity;
import org.springframework.web.bind.annotation.RequestMapping;
import org.springframework.web.bind.annotation.RestController;

@RestController
@RequestMapping("/fallback")
public class GatewayFallbackController {
  @RequestMapping("/account")
    public ResponseEntity<String> getAccount() {
      System.out.println("In account fallback");
      return ResponseEntity.status(HttpStatus.INTERNAL_SERVER_ERROR)
                 .body("There is a problem in AccountService, please try after some time");
    }
    
  @RequestMapping("/customer")
    public ResponseEntity<String> getCustomer() {
      System.out.println("In customer fallback");
      return ResponseEntity.status(HttpStatus.INTERNAL_SERVER_ERROR)
                 .body("There is a problem in CustomerService, please try after some time");
    }
}

Note that @RequestMapping is used with methods too rather than using @GetMapping, @PostMapping etc. as that makes more sense with fallback methods which are neither used to fetch data nor to insert or update or delete.

Resilience4J Configuration

Circuit breaker configuration can also be prvided using code or config in this example it is provided using code.

import java.time.Duration;

import org.springframework.cloud.circuitbreaker.resilience4j.ReactiveResilience4JCircuitBreakerFactory;
import org.springframework.cloud.circuitbreaker.resilience4j.Resilience4JConfigBuilder;
import org.springframework.cloud.client.circuitbreaker.Customizer;
import org.springframework.context.annotation.Bean;
import org.springframework.context.annotation.Configuration;

import io.github.resilience4j.circuitbreaker.CircuitBreakerConfig;
import io.github.resilience4j.circuitbreaker.CircuitBreakerConfig.SlidingWindowType;
import io.github.resilience4j.timelimiter.TimeLimiterConfig;

@Configuration
public class ResilienceConfig {
  @Bean
  public Customizer<ReactiveResilience4JCircuitBreakerFactory> defaultCustomizer() {
      return factory -> factory.configureDefault(id -> new Resilience4JConfigBuilder(id)
          .timeLimiterConfig(TimeLimiterConfig.custom()
              .timeoutDuration(Duration.ofMillis(2000))
              .build())
            .circuitBreakerConfig(CircuitBreakerConfig.custom()
                    .slidingWindowSize(10)
                    .slidingWindowType(SlidingWindowType.COUNT_BASED)
                    .permittedNumberOfCallsInHalfOpenState(3)
                    .failureRateThreshold(50.0F)
                    .waitDurationInOpenState(Duration.ofSeconds(5))
                    .slowCallDurationThreshold(Duration.ofMillis(200))
                    .slowCallRateThreshold(50.0F)
                    .automaticTransitionFromOpenToHalfOpenEnabled(true)
                    .minimumNumberOfCalls(5)
                    .build())
          .build());
  }
}

To get more information about the configured properties please refer this post- Spring Boot Microservice Circuit Breaker Using Resilience4j

Testing API gateway

To test API gateway please start all the services- eureka-discovery-service, customer-service, account-service and gateway-service.

Now all the interaction with the services is done using gateway-service. If we want to get customer information we'll call http://localhost:8181/customer/1 not http://localhost:8081/customer/1 same way to access account-service http://localhost:8181/account/.

Using the predicate which was configured in application.yml it will match it to the correct destination URL.

Inserting new Account

API Gateway Example

Accessing Customer information along with associated accounts.

If Customer Service is not reachable (goes to fallback)-

API Gateway with circuit breaker

If Account Service is not reachable (goes to fallback)-

You can access the circuit breaker metrics using the URL- http://localhost:8181/actuator/health Following image shows the metrics when the circuit is open because of the consecutive failed calls.

That's all for this topic Spring Boot Microservice + API Gateway + Resilience4J. If you have any doubt or any suggestions to make please drop a comment. Thanks!

>>>Return to Spring Tutorial Page


Related Topics

  1. Spring Boot Microservice - Externalized Configuration With Spring Cloud Config
  2. Spring Boot Microservice - Load-Balancing With Spring Cloud LoadBalancer
  3. Spring Boot Microservice - Eureka + LoadBalancer + Feign
  4. Spring Boot Observability - Distributed Tracing, Metrics
  5. Spring Boot Event Driven Microservice With Kafka

You may also like-

  1. Spring Bean Life Cycle
  2. Connection Pooling Using C3P0 Spring Example
  3. Spring MVC - Binding List of Objects Example
  4. Spring Batch Processing With List of Objects in batchUpdate() Method
  5. Package in Java
  6. Java Lambda Expression Callable Example
  7. Abstract Class in Python
  8. Angular Event Binding With Examples

Monday, February 26, 2024

Spring Boot Microservice Circuit Breaker Using Resilience4j

In this tutorial we'll see how to configure circuit breaker using Resilience4j in your Spring Boot microservices.

What is circuit breaker pattern

In terms of electronics, circuit breaker is a device that interrupts the flow of current. In case of any fault, circuit is opened interrupting the flow of current and protecting the electrical system from any damage.

In terms of microservice if two services are communicating, for example ServiceA and ServiceB. If ServiceB is down because of any problem then request from ServiceA won't get a response and there is no way to inform other requests from ServiceA about the problem downstream. So repeated requests from ServiceA will all fail resulting in failure of ServiceA too.

It may also result in a cascading effect on other services in the system and affect the overall system availability.

That's where circuit breaker pattern can be used in microservices to open the circuit in case of any problem so that further requests are not sent downstream until the problem is solved.

How does circuit breaker pattern work for microservices

With the circuit breaker configuration, you can define a threshold value for the circuit to open. When the service trying to communicate to another service fails more times than the threshold value, circuit opens for a given time period. During this specific time period (which is also configurable) requests are not sent to the failing service.

Once the time duration ends circuit breaker transitions to half-open state during which limited number of calls are sent to the failing service to check whether it is working fine now or problem is still there. If requests are processed, services start working normally otherwise circuit again goes to open state for the given time period.

Resilience4J Library

Resilience4j is a lightweight fault tolerance library providing the following functionalities-

  • Circuit Breaker- To prevent cascading failures and improve fault tolerance.
  • Rate Limiter- To limit the number of requests
  • Time Limiter- To limit the time service waits for an operation to complete.
  • Bulkhead- To limit the number of concurrent executions.
  • Retry- To manage retry for failed operations.

In Resilience4J, CircuitBreaker is implemented via a finite state machine with three normal states:

  • CLOSED- This is the initial state when both services are running and interaction between services is smooth. When in closed state, Circuit breaker keeps track of the requests and count of failed requests.
  • OPEN- If the count of failed requests exceeds the threshold value circuit breaker changes to open state. During open state communication between microservices is blocked and the circuit breaker throws a CallNotPermittedException for any request to the failing service.
  • HALF_OPEN- After the configured timeout period, circuit breaker transitions to half_open state. In this state a limited number of requests to the failing service are allowed, if the requests are successful then the circuit breaker goes to closed state otherwise it goes back to open state blocking any requests for the specific time period.
and two special states:
  • DISABLED
  • FORCED_OPEN
Circuit Breaker States

Spring Boot Microservice - Resilience4J Circuit breaker example

In this microservice circuit breaker example we'll use the example shown in this post- Spring Boot Microservice - Service Registration and Discovery With Eureka as our base example and add the Resilience4J circuit breaker related configurations.

In the example we'll have two services CustomerService and AccountService to cater to customer and account related functionality respectively. When customer information is retrieved it should also get the accounts associated with the specific customer. For getting the associated accounts for a customer we'll have to make a call from CustomerService to AccountService.

Adding maven dependencies for Resilience4J

There are two starters for the Resilience4J implementations, one for reactive applications and one for non-reactive applications.

org.springframework.cloud:spring-cloud-starter-circuitbreaker-resilience4j - non-reactive applications
org.springframework.cloud:spring-cloud-starter-circuitbreaker-reactor-resilience4j - reactive applications

Here I have added the reactive one. Dependency for actuator is also added so that we can check the status of service later.

<dependency>
  <groupId>org.springframework.boot</groupId>
  <artifactId>spring-boot-starter-actuator</artifactId>
</dependency>
<dependency>
    <groupId>org.springframework.cloud</groupId>
    <artifactId>spring-cloud-starter-circuitbreaker-reactor-resilience4j</artifactId>
</dependency>

Resilience4J circuit breaker configuration

You can configure your CircuitBreaker instance in Spring Boot's application.yml config file. For our example this will be done in the application.yml of CustomerService.

server:
  port: 8081
spring:
  datasource:
    url: jdbc:mysql://localhost:3306/customer
    username: root
    password: admin
  application:
    name: customer-service
  jpa:
    properties:
      hibernate:
        sqldialect: org.hibernate.dialect.MySQLDialect
        showsql: true

eureka:
  client:
    serviceUrl:
      defaultZone: http://localhost:8761/eureka
      
management:
  endpoint:
    health:
      show-details: always
  endpoints:
    web:
      exposure:
        include: health
  health:
    circuitbreakers:
      enabled: true

resilience4j:
  circuitbreaker:
    configs:
      default:
        register-health-indicator: true
        failure-rate-threshold: 60
        minimum-number-of-calls: 5
        automatic-transition-from-open-to-half-open-enabled: true
        wait-duration-in-open-state: 5s
        permitted-number-of-calls-in-half-open-state: 3
        sliding-window-size: 10
        sliding-window-type: COUNT_BASED
    instances:
      customer-service:
        base-config: default

As you can see changes in the existing application.yml are the configuration for the actuator and for the Resilience4J circuit breaker.

Spring Boot Actuator health information can be used to check the status of your running application. By default, the CircuitBreaker health indicators are disabled, but you can enable them via the configuration.

health:
    circuitbreakers:
      enabled: true

You can provide the default circuit breaker configuration and later associate it with service instances.

instances:
  customer-service:
    base-config: default

That way you can override default configuration if needed. For example

instances:
  customer-service:
    base-config: default
      waitDurationInOpenState: 10s

Explanation for the configured properties

failureRateThreshold- Configures the failure rate threshold in percentage. When the failure rate is equal or greater than the threshold the CircuitBreaker transitions to open and starts short-circuiting calls. Default is 50.

slidingWindowSize- Configures the size of the sliding window to record the result of the calls. For example, if size is 10 it will keep the record of 10 latest calls.

slidingWindowType- Configures the type of the sliding window. It can be COUNT_BASED or TIME_BASED. If slidingWindowSize is 10 and the slidingWindowType is COUNT_BASED then the last 10 calls are recorded and aggregated. If the type is TIME_BASED the the calls of the last 10 seconds are recorded and aggregated.

minimumNumberOfCalls- Configures the minimum number of calls which are required before the CircuitBreaker can calculate the error rate or slow call rate. For example, if minimumNumberOfCalls is 5, then at least 5 calls must be recorded, before the failure rate can be calculated.
If 3 out of those 5 calls fail then the failureRateThreshold of 60% is hit and the circuit is opened.

automaticTransitionFromOpenToHalfOpenEnabled- If set to true it means that the CircuitBreaker will automatically transition from open to half-open state and no call is needed to trigger the transition.

waitDurationInOpenState- The time that the CircuitBreaker should wait before transitioning from open to half-open.

permittedNumberOfCallsInHalfOpenState- Configures the number of permitted calls when the CircuitBreaker is half open.

Adding @CircuitBreaker annotation

We need to add @CircuitBreaker annotation with the service name and the fallback method name.

If a fallback method is configured, every exception is forwarded to a fallback method executor. Fallback method should be placed in the same class where you have the real method and must have the same method signature as the real method with just one extra target exception parameter. Here is the changed CustomerServiceImpl class.

import io.github.resilience4j.circuitbreaker.annotation.CircuitBreaker;

@Service
public class CustomerServiceImpl implements CustomerService{
  private final CustomerRepository customerRepository;
  private final RestTemplate restTemplate;
  
  CustomerServiceImpl(CustomerRepository customerRepository, RestTemplate restTemplate){
    this.customerRepository = customerRepository;
    this.restTemplate = restTemplate;    
  }

  @Override
  public Customer saveCustomer(Customer customer) {
    return customerRepository.save(customer);
  }
  
  @Override
  @CircuitBreaker(name="customer-service", fallbackMethod = "getDefaultCustomer")
  public CustomerDto getCustomerById(Long id) {
    Customer customer = customerRepository.findById(id)
                 .orElseThrow(()-> new CustomerServiceException("No customer found for the given id - " + id));
    
    ResponseEntity<List<AccountDto>> response = restTemplate.exchange("http://ACCOUNT-SERVICE/account/customer/"+id, HttpMethod.GET, null, 
        new ParameterizedTypeReference<List<AccountDto>>(){});
    List<AccountDto> accounts = response.getBody();
    CustomerDto customerDto = CustomerDto.builder()
           .id(customer.getId())
           .name(customer.getName())
           .age(customer.getAge())
           .city(customer.getCity())
           .accounts(accounts)
           .build();
    return customerDto;
    
  }
  
  // Fallback method
  public CustomerDto getDefaultCustomer(Long id, Exception e){
    //log the error properly
    System.out.println("Error... " + e.getMessage());
    Customer customer = customerRepository.findById(id)
         .orElseThrow(()-> new CustomerServiceException("No customer found for the given id - " + id));
    CustomerDto customerDto = CustomerDto.builder()
           .id(customer.getId())
           .name(customer.getName())
           .age(customer.getAge())
           .city(customer.getCity())
           .accounts(new ArrayList<AccountDto>())
           .build();
    return customerDto;
  }
}

Note that in the fallback method accounts property in CustomerDTO is an empty list. As this fallback method is called when AccountService is failing so account information is kept as an empty list.

Test the circuit breaker

Start the eureka-discovery-service, customer-service and account-service. If I try to access URL http://localhost:8081/customer/1 I should get the customer information along with the associated accounts.

You can also check the health metrics by accessing http://localhost:8081/actuator/health

status	"UP"
components	
  circuitBreakers	
  status	"UP"
  details	
    customer-service	
    status	"UP"
    details	
      failureRate	"-1.0%"
      failureRateThreshold	"60.0%"
      slowCallRate	"-1.0%"
      slowCallRateThreshold	 "100.0%"
      bufferedCalls	1
      slowCalls	0
      slowFailedCalls	0
      failedCalls	0
      notPermittedCalls	0
      state	            "CLOSED"

As you can see this is the scenario where both services are running, interaction between them is happening and the circuit has the state "CLOSED". If you click the URL http://localhost:8081/customer/1 again you can see that the bufferedCalls changes to 2. Which means circuit breaker is keeping track of the records.

Now let's shut down the account-service so it is not available any more and then notice the health of the system. If you access the URL http://localhost:8081/customer/1 now the result you get is as given below. Only customer details are there for accounts an empty list is returned. This is through the fallback method.

id	1
name	"Ram"
age	25
city	"New Delhi"
accounts	[]

In the logs of customer-service you should get this line-

Error... I/O error on GET request for "http://ACCOUNT-SERVICE/account/customer/1": Connection refused: connect

If you go to the URL http://localhost:8081/actuator/health, you will notice that circuit is still closed as the threshold value is not met yet. Click the URL http://localhost:8081/customer/1 two more times so that it fails 3 times out of total 5 calls. That makes the failed call percentage as 60 which is equal to the threshold value. This opens the circuit.

At this time if you access the URL http://localhost:8081/actuator/health, you should get a result similar to as given below.

status	"UP"
components	
  circuitBreakers	
  status	"UNKNOWN"
  details	
    customer-service	
    status	"CIRCUIT_OPEN"
    details	
      failureRate	"60.0%"
      failureRateThreshold	"60.0%"
      slowCallRate	"0.0%"
      slowCallRateThreshold	"100.0%"
      bufferedCalls	5
      slowCalls	0
      slowFailedCalls	0
      failedCalls	3
      notPermittedCalls	0
      state	"OPEN"

If you go to the logs of customer-service there also you should see the message.

Error... CircuitBreaker 'customer-service' is OPEN and does not permit further calls

If you wait for 5 seconds, circuit breaker should automatically transition to HALF_OPEN state as per the given configuration.

status	"UP"
components	
  circuitBreakers	
  status	"UNKNOWN"
  details	
    customer-service	
    status	"CIRCUIT_HALF_OPEN"
    details	
      failureRate	"-1.0%"
      failureRateThreshold	"60.0%"
      slowCallRate	"-1.0%"
      slowCallRateThreshold	"100.0%"
      bufferedCalls	0
      slowCalls	0
      slowFailedCalls	0
      failedCalls	0
      notPermittedCalls	0
      state	"HALF_OPEN"

If you start the account-service again and click the URL http://localhost:8081/customer/1 three times which is equal to the value given for the property "permitted-number-of-calls-in-half-open-state" then circuit breaker should change to "CLOSED" state since all the calls will work.

If you don't start the account-service and click the URL http://localhost:8081/customer/1 three times when circuit breaker is in "HALF_OPEN" state, it will again change to "OPEN" state as all the calls will fail.

That's all for this topic Spring Boot Microservice Circuit Breaker Using Resilience4j. If you have any doubt or any suggestions to make please drop a comment. Thanks!

>>>Return to Spring Tutorial Page


Related Topics

  1. Spring Boot Microservice - Externalized Configuration With Spring Cloud Config
  2. Spring Boot Microservice - Load-Balancing With Spring Cloud LoadBalancer
  3. Spring Boot Microservice Example Using WebClient
  4. Spring Boot Microservice Example Using FeignClient
  5. Spring Boot + Spring Security JWT Authentication Example

You may also like-

  1. @Conditional Annotation in Spring
  2. Spring MVC Pagination Example Using PagedListHolder
  3. Spring MVC - Binding List of Objects Example
  4. Spring NamedParameterJdbcTemplate Select Query Example
  5. Access Modifiers in Java - Public, Private, Protected and Default
  6. Java Stream - boxed() With Examples
  7. Class And Object in Python
  8. React Declarative Approach